
-

GHOST CAP
-
HEY F*CK F*CK
-
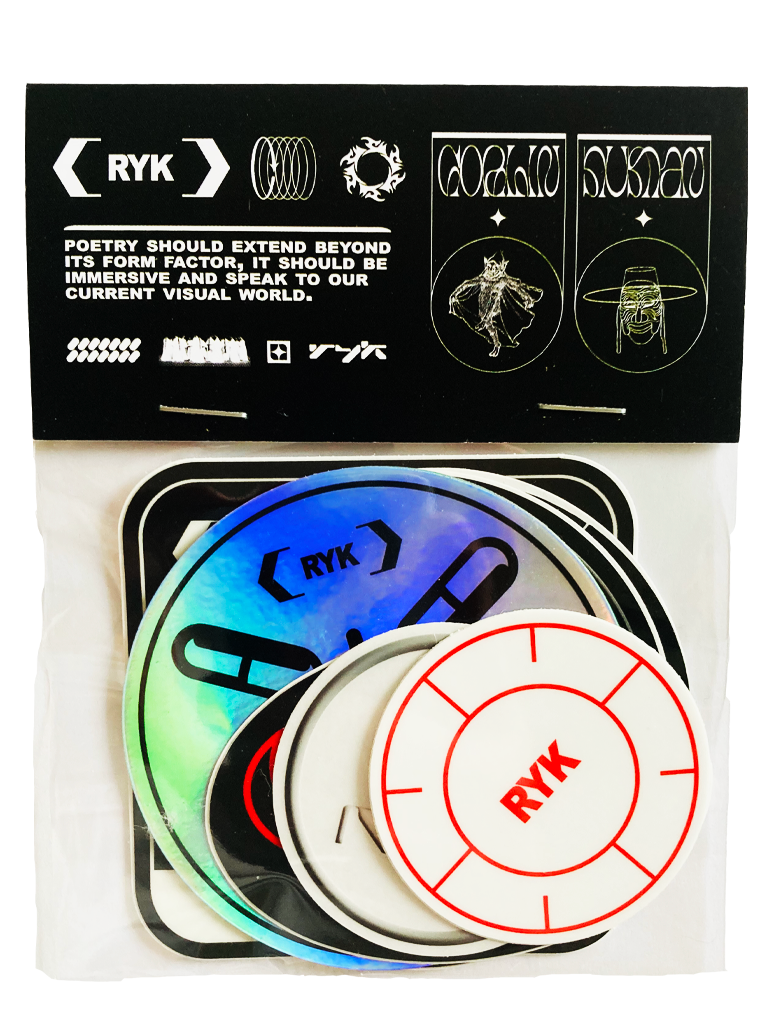
STICKER PACK
-

RAIN JACKET
ABOUT
Rickey Y. Kim aka RYK is a Los Angeles based poet. His published book, ‘Heart to Heart: Poems and Short Stories’ is a compendium of musings and observations from the perspective of a second generation Korean American.
Love, loss and redemption are central themes in this self confession. Written chronologically paired with graphic design, ‘Heart to Heart’ is a direct end product of our contemporary times, having been published during the height of covid and social unrest.
Heart to Heart is currently sold at Barnes & Nobles, Powells, Skylight and other fine book retailers.